CAPSTONE DESIGN SHOWCASE 2022
-
DAYS
-
HOURS
-
MINUTES
-
SECONDS
COMING SOON


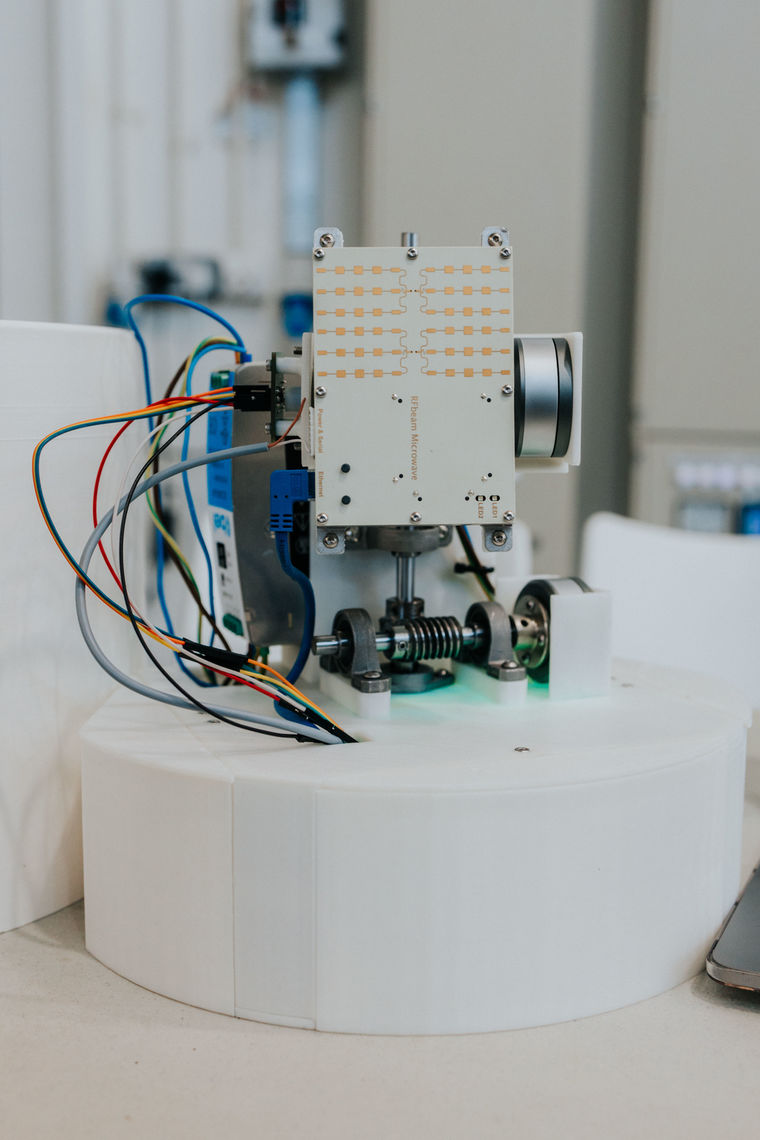
Team members
Ho Si Ci (EPD), Luu Nguyen Nguyen Long (EPD), Chew Yoong Hao (EPD), Koh Kai Ting (ESD), Lee Wei Yang (ESD), Lim Xin Yi (ISTD)
Instructors:
Nagarajan Raghavan, Berrak Sisman, Francisco Benita
Writing Instructors:
Teaching Assistant: